The 3rd harmonic distortion meter has been designed for measuring the quality of AC supply. The meter is built with a PIC18F2550 project board and the full wave rectifier front-end circuit. The AC power line, 220VAC is measured through the step down isolation transformer. The input signal to the 10-bit ADC is full wave rectified. The software performs DFT calculation finding the amplitude of the fundamental frequency and the 3rd harmonic. The distortion is computed by the ratio of the amplitude of the 3rd harmonic to the fundamental frequency. The meter has been tested with the square wave signal resulting 33% distortion. For low voltage AC utility, 220V, the reading showed approx. 3%. The meter can be applied for high voltage application with the appropriate signal conditioning.
 |
| Figure 1: PIC Harmonic Distortion Meter |
Introduction
Nowadays an increasing of the
electronic devices having nonlinear characteristics are many used at home
and office. Such devices mostly are computer based equipment with a low power
factor switch mode power supply. The input circuit of the power supply uses
a diode-capacitor at the front-end circuit. The current drawn is charging
capacitor only near the peak voltage. Thus for a given feeder having finite
impedance, there will be a lost from voltage dropped near the peak voltage
resulting flattened top distortion of the AC voltage. To measure how high
the distortion of AC voltage is, we may decompose it into the summation of
sinusoid waves using DFT. The PIC harmonic distortion meter shows a method
for finding the amplitude of the fundamental frequency and the 3rd harmonic.
The reading shows percentage of the 3rd harmonic distortion.
 |
| Figure 2: Flatted top AC voltage caused by a low power factor switch mode power supply. |
Total Harmonic Distortion, THD
To measure the
wave shape distortion, we use the quantity of the Total Harmonic Distortion,
THD (equation 1). THD is the ratio of the power of harmonic components to
the power of fundamental frequency. Our concern is the voltage distortion,
we can just find the sum of the rms of the harmonic components, Vn and the
rms of the fundamental frequency, V1.
 |
Most of the harmonic problem is caused by the 3rd component. Since the 3rd harmonic is the 2nd highest energy from the fundamental component. So we interest to find only the 3rd harmonic distortion using equation 2.
 |
Discrete Fourier Transform, DFT
We may decompose the periodic waveform, f(t) into the summation
of a number of sinusoids waveform easily using the Discrete Fourier Transform
(equation 3). A0 is the amplitude of DC components. For AC voltage waveform,
A0 is zero.
 |
The amplitude for each harmonic can be computed from equation 4.
 |
The coefficients Bv and Cv for each harmonic are easily calculated by multiplying the corresponding sine wave and cosine wave to the input signal respectively (equation 5 and 6). Where delta t is time between sample, T is period, Vy is input signal.
 |
Since the AC signal has symmetry between positive cycle and negative cycle. We can find the harmonic component by capturing only half cycle. This reduces computing time by half.
Input Circuit for PIC Project Board
The hardware of the PIC Harmonic Distortion Meter is a the PIC18F2550 project board with the input circuit that receives AC signal from the isolated transformer. We made it with bridge diode and 20k voltage divider to provide a signal range for 0 to +5V ADC input of the PIC chip.
Figure 3 shows the sample of input data for DFT calculation. The ADC data is 32-point 10-bit resolution.
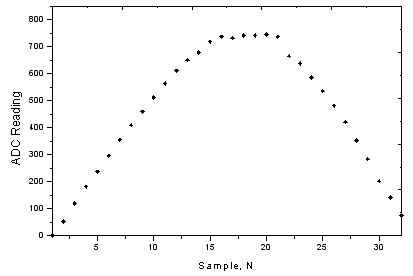 |
| Figure 3: The 32-point sample half period AC input signal (see the flatten top). |
From equation 5 and 6 we will see, it is very easy to find the coefficients Bv and Cv for the fundamental frequency and 3rd harmonic. The software provides sine and cosine data for 50Hz and for 150Hz. The method is to find correlation between input signal and the sinusoid wave shape for 50Hz and 150Hz.
 |
| Figure 4: The 32-point sine data for fundamental frequency and 3rd harmonic. |
 |
| Figure 4: The 32-point cosine data for fundamental frequency and 3rd harmonic. |
Testing with Input AC Signal
The
testing shows the input signal and 3rd harmonic detector (shown in THD) for
a clean sine wave, square wave and the university AC plug.
 |
| Figure 5: Clean sine wave, 3rd harmonic distortion <0.5% (no harmonic, shown only fundamental frequency). |
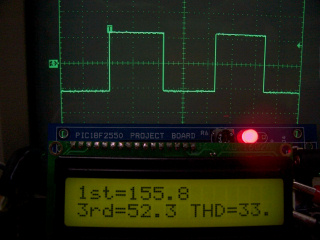 |
| Figure 6: Square wave, 3rd harmonic distortion ~ 33%. |
 |
| Figure 7: Distorted University AC plug, 3rd harmonic distortion ~ 4%. |
 |
| Figure 8: Demonstration of the 3rd harmonic meter to the students on the Science Day 2550. |
Conclusion
We built a cheap instrument for measuring the 3rd harmonic of AC power line with PIC18F2550 microcontroller. The software performs simple DFT calculation finding the amplitude of fundamental frequency (50Hz) and the 3rd harmonic (150Hz).
Download DFT.C and HEXfile DFT.HEX .
2nd version with alarm and overload indicator
The 2nd version firmware has been developed featuring the alarm and overload signal input indicators. Figure 9 shows the power on text message.
 |
| Figure 9: Power on text message, "Power Line 3rd Harmonic Meter". |
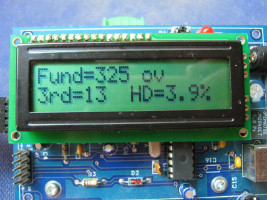
As shown below, the first line is the amplitude of the fundamental frequency (50Hz). And the 2nd line is the 3rd harmonic amplitude. The Harmonic Distortion (HD) is displayed as HD=7.3%. When the distortion factor is over 5%, (as shown 7.3%) the symbol X will blink.
 |
| Figure 10: The X symbol indicates the 3rd harmonic distortion is over 5%. |
If the signal input is overload, resulting the clipped waveform, the ov symbol will be indicated. We can slightly adjust the POT until the ov disappeared.
|
| Figure 11: The ov symbol indicates the signal input is overload. |
The signal input for DFT calculation can be only positive cycle (symmetry property), so we can use the bridge diode to provide full wave rectified signal and the voltage divider to provide proper level for ADC input.
 |
 |
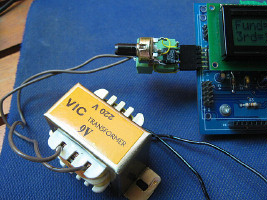
| Figure 12: The small transformer provides safety isolation for student and the 9VAC input signal. | Figure 13: The front end circuit is built with T1, isolation transformer, D1 bridge diode and R1 variable resistor. R1 is simple voltage divider providing 0-5V full-wave signal. |
Download source code (50Hz AC power line) DFT.C HEX file DFT.hex
<
11 July 2009
recovered 16 December 2015